Bitcoin (BTC) Price Index
(cointelegraph.com)
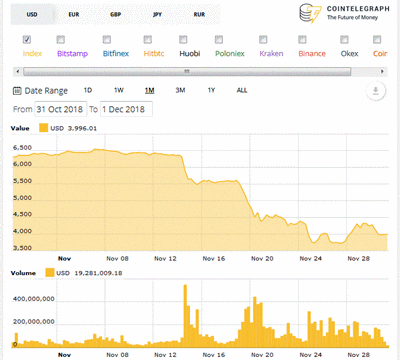
When I look at the chart I see sideways price movement (= no movement) for the first half of the month, followed by three distinct downward price shifts. Using the same mouseover mechanism that I noted last month in Bitcoin in the News : 2018-10 Price, these downward shifts can be roughly pegged to these start times:-
- 14 Nov 06:00
- 19 Nov 00:00
- 24 Nov 12:00
Looking at the stories in Cointelegraph's Analysis category (in which there are less than half the number of stories for October), only one story addresses (the first two of) the three drops.
2018-11-22: What Is Going On With the Crypto Markets, Analysts Unpack Factors Behind 10-Days Slump • 'Over the last 10 days the cryptocurrency markets have endured a massive sell-off across the board. There are a number of reasons that have led to the highly bearish sentiments on the market but seeing red has been difficult for many. As the value of Bitcoin and numerous altcoins have continued to decline to depressing levels, and a certain amount of panic has ensued.'
A graph of 'Total Market Capitalization' (of what, exactly, isn't clear) shows the market cap going from just over $200B to $150B starting 14 November. The first discussion in the story reduces to:-
'Main factors to consider' : Bitcoin Cash fork, Regulatory pressures, Global pressures (e.g. Brexit)
The other discussions are:-
'“Does this mean Bitcoin is broken? No”', 'Low trade volumes and high uncertainty', and 'A short term outlook'
The 'Bitcoin is broken?' section shows indices for three major American equity markets, all dropping lower on 20 November in tandem. All in all, none of these discussions is particularly revealing and I'm not convinced that this 'What Is Going On' story is anything deeper than cheerleading. Under Cointelegraph's Price Analysis tag, I found three stories coinciding with the drops.
2018-11-14: Bitcoin, Ethereum, Ripple, Bitcoin Cash, EOS, Stellar, Litecoin, Cardano, Monero, TRON: Price Analysis, Nov. 14 • 'Major cryptocurrencies have seen major losses today after months of stability, with Bitcoin reaching a new low for 2018.'
2018-11-19: Bitcoin, Ripple, Ethereum, Stellar, EOS, Litecoin, Cardano, Monero, TRON, IOTA: Price Analysis, Nov. 19 • 'Following the increase in volatility and a renewed downtrend in markets, some analysts have projected abysmally low prices for Bitcoin.'
2018-11-26: Bitcoin, Ripple, Ethereum, Bitcoin Cash, Stellar, EOS, Litecoin, Cardano, Monero, TRON: Price Analysis, Nov. 26 • 'Rampant selling in recent weeks dragged total market capitalization from above $210 billion on Nov. 14 to just below $116 billion on Nov. 25.'
If I had the time, I would look at these analyses in more depth, but I'm again not convinced that I would find any real explanations. Maybe I'll find the time to look at them when I work on the second post this month, like last month's Bitcoin in the News : 2018-10 More++.
Back to the November chart above, I noticed that there are three additional price sources available over what was shown in the '2018-10 Price' post.
(A : 2018-10 Price) Index, Binance, Bitfinex, Bitstamp, Gdax, Hitbtc, Kraken
(B : 2018-11 Price) Index (A1), Bitstamp (A4), Bitfinex (A3), Hitbtc (A6), Huobi, Poloniex, Kraken (A7), Binance (A2), Okex, Coin
That brief (A/B) analysis shows that one source disappeared between (A) and (B), 'Gdax', and four were added. It might again be useful to look at these changes in more depth, but at least I've flagged the keywords for any future searches on this blog.
No comments:
Post a Comment