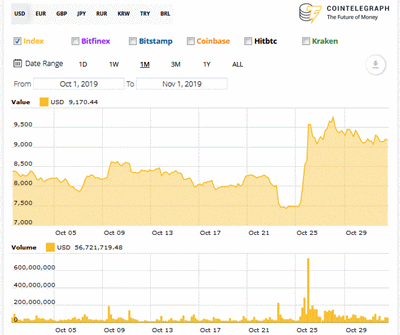
The market is in a state of equilibrium, then something happens -- always accompanied by significant volume -- to move it quickly to another state of equilibrium.
The chart below shows a heavy volume for the most important move, heavier than I have recorded at any time this year (remembering that the bars in the chart cover a four hour period, if they can be believed at all).
The starts of the two most pronounced price movements were:-
2019-10-22 0800 (Drop)
2019-10-25 0400 (Jump)
Each movement lasted about a day. Cointelegraph's Analysis category had nothing about the movements, while the site's Price Analysis tag covered both. First, here's an interesting, but misleading, observation from a few days before the drop.
2019-10-21: Price Analysis 21/10: BTC, ETH, XRP, BCH, LTC, EOS, BNB, BSV, XLM, TRX • 'While the supply of fiat currencies has been steadily increasing for the past few years, Bitcoin’s (BTC) block rewards has reduced at each halving. The rate of supply will reduce further following the halving in 2020. Previous instances of halving resulted in a sharp price increase and for this reason analysts are anticipating a repeat rally as the 2020 block reward halving approaches.'
If everyone knows when an event will occur and if there is general agreement on the impact of the event, then that information is already baked into the price. There is no 'insider information' in bitcoin, although this isn't necessarily true of all crypto currencies.
2019-10-23: Price Analysis 23/10: BTC, ETH, XRP, [...] • 'Bitcoin’s (BTC) plunged today, dragging the whole crypto space along with it. [...] At the moment, there is not a direct reason that explains today’s strong correction. Some analysts believe that Facebook CEO Mark Zuckerberg’s testimony before the United States Congress on Libra might have triggered the fall.'
A news article on the same day, 3 Likely Reasons Why Bitcoin Price Crashed, offered a few more explanations:-
1. Technicals: support finally gives after 9th try
2. Mr. Zuckerberg goes to Washington
3. Google’s quantum breakthrough spooks Bitcoin investors?
That last explanation deserves a deeper look than I can give it now. For a previous post on this blog concerning quantum computing, see Shor's Algorithm (November 2016). Back to the chart and the associated Cointelegraph analysis, the 2000 point increase was covered a few days after it occurred.
2019-10-28: Price Analysis 28/10: BTC, ETH, XRP, [...] • 'The seesaw price action over the past week has lightened up the crypto space once again. While the aggressive bulls view the sharp upside move as a bottoming signal, the bears consider the rise as a bear market rally that should be sold into.'
That wishy-washy forecast continued for the rest of the article. Apparently, no one understands the cause of these sharp movements. There were two smaller volume spikes starting 2019-10-09, but I have no reason to believe that they would shed new light here.

No comments:
Post a Comment