08 December 2018

Bitcoin in the News : 2018-11 More++

In last week's post, Bitcoin in the News : 2018-11 Price, I wrote, 'The month of November 2018 must show the worst chart for bitcoin during nearly two years.' I summarized the post with:-
When I look at the chart I see sideways price movement (= no movement) for the first half of the month, followed by three distinct downward price shifts. [...] These downward shifts can be roughly pegged to these start times:-
- 14 Nov 06:00
- 19 Nov 00:00
- 24 Nov 12:00

How to explain the drops? In separate 'Bitcoin in the News' posts a few months ago I highlighted two mainstream financial news services...

...by showing which stories had been published by the two news services. Let's do the same for November, comparing the stories from both services with the goal of understanding the November price movements. Of course, this isn't a comprehensive look at all of their stories -- it's a list of stories that were flagged by Google News, using whatever its criteria are.

CNBC:-

Forbes:-

Why are there more stories from Forbes? Because the service appears to have more writers covering the bitcoin++ topic. Since I have one extra Saturday this month to explore the topic, I'll use it to take a closer look at the relevant stories from both sources.

Before closing today's post, I have one more story to highlight. It's related to the first CNBC story, 'Bitcoin turns 10 years old':-

The story is based on a Morgan Stanley report and copied the following chart.
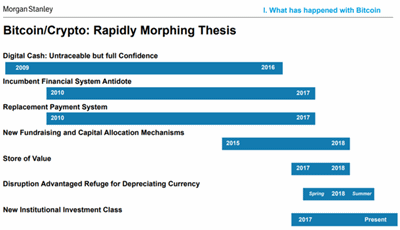

'The evolution of bitcoin'

From 'Digital Cash: Untraceable but full Confidence' (Ha!) to 'New Institutional Investment Class' (Huh?), the 'Bitcoin/Crypto' believers have been one chasing one elusive thesis after another.

01 December 2018

Bitcoin in the News : 2018-11 Price

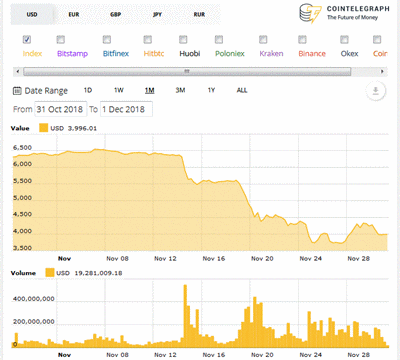
Next month, January 2019, will mark two years since I've limited this bitcoin blog to two posts per month, where the first post has been a chart of the previous month's price movements. The month of November 2018 must show the worst chart for bitcoin during the nearly two years.


Bitcoin (BTC) Price Index (cointelegraph.com)

When I look at the chart I see sideways price movement (= no movement) for the first half of the month, followed by three distinct downward price shifts. Using the same mouseover mechanism that I noted last month in Bitcoin in the News : 2018-10 Price, these downward shifts can be roughly pegged to these start times:-

  • 14 Nov 06:00
  • 19 Nov 00:00
  • 24 Nov 12:00

Looking at the stories in Cointelegraph's Analysis category (in which there are less than half the number of stories for October), only one story addresses (the first two of) the three drops.

2018-11-22: What Is Going On With the Crypto Markets, Analysts Unpack Factors Behind 10-Days Slump • 'Over the last 10 days the cryptocurrency markets have endured a massive sell-off across the board. There are a number of reasons that have led to the highly bearish sentiments on the market but seeing red has been difficult for many. As the value of Bitcoin and numerous altcoins have continued to decline to depressing levels, and a certain amount of panic has ensued.'

A graph of 'Total Market Capitalization' (of what, exactly, isn't clear) shows the market cap going from just over $200B to $150B starting 14 November. The first discussion in the story reduces to:-

'Main factors to consider' : Bitcoin Cash fork, Regulatory pressures, Global pressures (e.g. Brexit)

The other discussions are:-

'“Does this mean Bitcoin is broken? No”', 'Low trade volumes and high uncertainty', and 'A short term outlook'

The 'Bitcoin is broken?' section shows indices for three major American equity markets, all dropping lower on 20 November in tandem. All in all, none of these discussions is particularly revealing and I'm not convinced that this 'What Is Going On' story is anything deeper than cheerleading. Under Cointelegraph's Price Analysis tag, I found three stories coinciding with the drops.

2018-11-14: Bitcoin, Ethereum, Ripple, Bitcoin Cash, EOS, Stellar, Litecoin, Cardano, Monero, TRON: Price Analysis, Nov. 14 • 'Major cryptocurrencies have seen major losses today after months of stability, with Bitcoin reaching a new low for 2018.'

2018-11-19: Bitcoin, Ripple, Ethereum, Stellar, EOS, Litecoin, Cardano, Monero, TRON, IOTA: Price Analysis, Nov. 19 • 'Following the increase in volatility and a renewed downtrend in markets, some analysts have projected abysmally low prices for Bitcoin.'

2018-11-26: Bitcoin, Ripple, Ethereum, Bitcoin Cash, Stellar, EOS, Litecoin, Cardano, Monero, TRON: Price Analysis, Nov. 26 • 'Rampant selling in recent weeks dragged total market capitalization from above $210 billion on Nov. 14 to just below $116 billion on Nov. 25.'

If I had the time, I would look at these analyses in more depth, but I'm again not convinced that I would find any real explanations. Maybe I'll find the time to look at them when I work on the second post this month, like last month's Bitcoin in the News : 2018-10 More++.

Back to the November chart above, I noticed that there are three additional price sources available over what was shown in the '2018-10 Price' post.

(A : 2018-10 Price) Index, Binance, Bitfinex, Bitstamp, Gdax, Hitbtc, Kraken

(B : 2018-11 Price) Index (A1), Bitstamp (A4), Bitfinex (A3), Hitbtc (A6), Huobi, Poloniex, Kraken (A7), Binance (A2), Okex, Coin

That brief (A/B) analysis shows that one source disappeared between (A) and (B), 'Gdax', and four were added. It might again be useful to look at these changes in more depth, but at least I've flagged the keywords for any future searches on this blog.

10 November 2018

Bitcoin in the News : 2018-10 More++

In my previous post, Bitcoin in the News : 2018-10 Price, I observed,
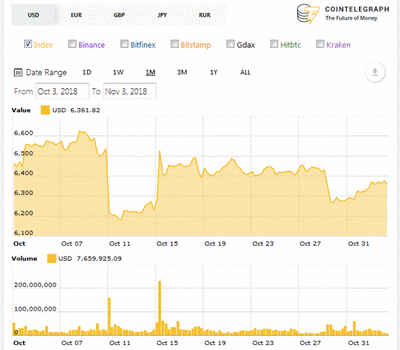
The price moved mostly sideways during the month. The exceptions were two sharp shifts with a large spike in volume, where a mouseover on Cointelegraph's original chart generates crosshairs that pinpoint the action to six hour time ranges:-
- 10 Oct between 1800 & 2400 (=0000 11 Oct)
- 15 Oct between 0000 & 0600
Cointelegraph's Analysis category had no articles to explain these movements.

Could the other news and analysis services explain the sharp shifts? The first of the events, a drop, had a straightforward explanation, which damages bitcoin's reputation as a 'safe haven' for money.

  • 2018-10-11: Bitcoin slumps more than 5%, puts ‘digital gold’ status in jeopardy (marketwatch.com) • 'Bitcoin prices on Thursday finally broke out of a recent lull, dropping as much as 6% [...] The decline comes on the heels of one of the worst sessions for global equities in 2018, putting bitcoin’s “digital gold” status in jeopardy. Bitcoin proponents have argued that the cryptocurrency would be a haven in times of turmoil, just like gold, and go up in value.'

The subsequent rebound was less straightforward. I chose another story from MarketWatch.

  • 2018-10-15: Bitcoin jumps after credit scare; Fidelity enters crypto sphere - MarketWatch (marketwatch.com):- • 'Bitcoin rose sharply Monday after a credit scare on a major cryptocurrency exchange created a rush for the No. 1 digital currency. [...] The move higher in bitcoin came at the expense of Tether (USDT), the stablecoin on the Bitfinex exchange, which traded to 88 cents. A stablecoin traditionally trades at or very close to $1 as it is a U.S. dollar backed coin that investors use to trade between different cryptocurrencies as opposed to going in and out of fiat.'

Tether the stablecoin? Sounds like an exercise involving horses. In fact, my '2018-10 Price' post gave a similar explanation -- 'Stable coin Tether is being cited as one of the main reasons for the spurt in crypto prices' -- although I failed to understand its meaning at the time. Here's another story from a reputable source.

  • 2018-10-15: Bitcoin Has Leapt Sharply Higher -- Here's Why (forbes.com):- • 'Bitcoin, which just last week had its first major sell-off in months, has this morning jumped almost 10% [...] The sudden rise in the bitcoin price this morning was signaled by a sell-off of the dollar-linked tether digital coin — the only cryptocurrency which is down today, according to CoinMarketCap data. Traders often sell tether to buy other cryptocurrencies and a sudden influx of tether sellers would push down the tether price — and boost the bitcoin price if that's what traders are moving their money to. Tether was down by some 3% in the run up to bitcoin's sudden price rise.'

This sounds suspiciously like the cart leading the horse. The phrase 'signaled by' doesn't necessarily imply a cause-effect relationship. It could be a side-effect, like smoke rising from a fire. As long as I'm on animal analogies, whales also received some attention. Here's another analysis from MarketWatch.

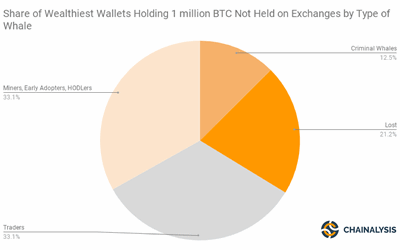
  • 2018-10-18: Bitcoin whales aren’t responsible for volatility, research firm finds:- (marketwatch.com) • 'The bitcoin whales are back. At least, that’s the conventional narrative that takes hold when the world’s largest cryptocurrency exhibits significant price swings, often over a short period. However, new data from Chainalysis, a blockchain research firm that specializes in detecting fraud and money laundering, suggest this isn’t to be the case. In fact, it is quite the opposite.'

The following chart shows four categories of whale, one of which is 'Lost'.

The last day of October marked a significant milestone in the bitcoin saga.

  • 2018-10-31: Factbox: Ten years of bitcoin (reuters.com) • 'Bitcoin, the world’s first and most famous cryptocurrency, celebrates its tenth birthday on Wednesday [31 October].'

The 31st of October is also known as Halloween. How's that for a scary coincidence?

03 November 2018

Bitcoin in the News : 2018-10 Price

In last month's Bitcoin in the News : 2018-09 Price, I had trouble capturing the price chart for September. This month I simply forgot -- 1 November is a public holiday in many Catholic countries -- and didn't get around to it until today. Note that for the first time in these monthly 'Price' posts the 'Date Range' is displayed even though I haven't specified it.


Bitcoin (BTC) Price Index

The price moved mostly sideways during the month. The exceptions were two sharp shifts with a large spike in volume (plus a smaller shift later in the month), where a mouseover on Cointelegraph's original chart generates crosshairs that pinpoint the action to six hour time ranges:-

  • 10 Oct between 1800 & 2400 (=0000 11 Oct)
  • 15 Oct between 0000 & 0600

Cointelegraph's Analysis category had no articles to explain these movements. The site's Price Analysis tag, which brings together posts based on technical analysis, had three articles which glossed over the sharp swings.

2018-10-13: Top 5 Crypto Performers Overview: TRON, Bitcoin, Litecoin, EOS, Cardano

On October 11, the total market capitalization of the cryptocurrencies plunged below $200 billion for the first time since September 20, as a global risk-off trade led investors to dump their holdings. However, the encouraging sign is that the sell-off was short-lived and most currencies are trying to claw back.

2018-10-15: Bitcoin, Ethereum, Ripple, Bitcoin Cash, EOS, Stellar, Litecoin, Cardano, Monero, TRON: Price Analysis, October 15

Stable coin Tether is being cited as one of the main reasons for the spurt in crypto prices that pushed total market capitalization above $221 billion on Monday (UTC time), but it was not a new issuance of Tether that was the catalyst for upward market movement.

2018-10-17: Bitcoin, Ethereum, Ripple, Bitcoin Cash, EOS, Stellar, Litecoin, Cardano, Monero, TRON: Price Analysis, October 17

While crypto markets have given up much of their Oct. 15 gains, they are still trading well above the recent lows, which is a positive sign. A knee-jerk reaction to a news event can propel the markets only to a certain level, after which fundamentals take over. The next leg of the up move will be based on strong fundamental news flows.

Last month I used a second post, Bitcoin in the News : 2018-09 More++, to analyze a similar drop. I'll do the same for October in my next post.

13 October 2018

Bitcoin in the News : 2018-09 More++

In last week's post, Bitcoin in the News : 2018-09 Price, I noted,
None of the stories in Cointelegraph's Analysis category attempted to explain the drop at the beginning of the month.

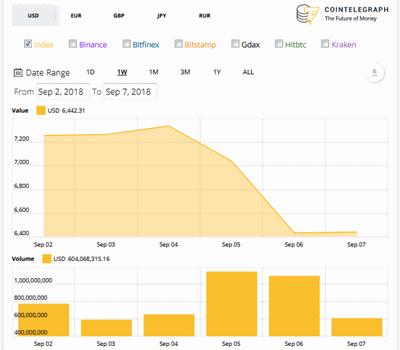
Here's a similar chart showing just the week when the drop occurred. For the record, 5 September was a Wednesday.

It's not a very good chart. The only prices shown are from the midpoint of each day (noon?, GMT?) and are connected with a straight line. The first story I read about the drop was from CNBC:-

  • 2018-09-05: Bitcoin falls after Goldman reportedly drops crypto trading plans (cnbc.com; 'Published 9:00 AM ET Wed, 5 Sept 2018 Updated 4:50 PM ET Wed, 5 Sept 2018') • 'Bitcoin slipped below $7,000 Wednesday after a report that Goldman Sachs is abandoning plans to open a trading desk for cryptocurrencies. Goldman still sees the regulatory environment as ambiguous, according to Business Insider, which cited people familiar with the matter.'

By coincidence, the second story I read was from Business Insider:-

  • 2018-09-05: Bitcoin price: Cryptocurrencies drop suddenly with no explanation (businessinsider.com; Sep. 5, 2018, 4:09 PM) • 'Cryptocurrency prices plunged across the board suddenly and sharply Wednesday morning, seemingly with no clear reason. Having been steady at about $7,350 a coin during most of trading during both Asian and European morning hours, bitcoin lost more than $200 in mere minutes starting about 5:50 a.m. ET, or 10:50 a.m. BST.'

Both stories, from CNBC and from Business Insider, pointed to another story from Business Insider:-

Note that the 'earlier' story is dated three days after the 'later' stories. There is probably a good explanation for this, but I can't think of one. The CNBC story has a detailed price chart showing a steady price followed by two sharp drops: one just before 6 AM (EDT) and another at 7 PM. It's hard to believe that unconfirmed news about a single trading desk could cause such a sudden price shift, but what do I know? Then there was another sharp drop into the following day. I wonder what caused that.

06 October 2018

Bitcoin in the News : 2018-09 Price

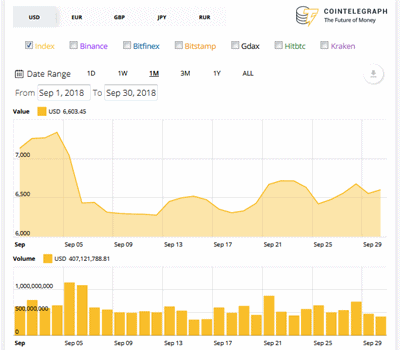
The price chart for September is a bit different than it was for last month's Bitcoin in the News : 2018-08 Price. When I tried to capture the monthly price chart on 1 October, I received only current prices with no chart. When I tried to capture the same chart while preparing this post, I received the normal chart with the first week of September missing, because the monthly chart only goes one month back. The first week of September showed a large price drop, so I couldn't just ignore it. What to do?

Since February, the Cointelegraph price service has offered the possibility of entering a from-to date range. I set this to 1 September through 30 September and received the chart shown below. The data granularity for a specified date range appears to be a full day; the granularity of the monthly chart appears to be six hours. That accounts for the difference in the look of the chart.


Bitcoin Price Index

None of the stories in Cointelegraph's Analysis category attempted to explain the drop at the beginning of the month. Of the 30 or so stories in the category, one in particular caught my attention:-

  • 2018-09-11: The Crypto IPO Race Is On: From Mining Companies to Exchanges • 'Last week, at least two crypto-related enterprises, a Silicon Valley stock and cryptocurrency trading platform Robinhood and Singapore-based crypto exchange Huobi, moved closer to going public by holding an initial public offering (IPO).' The ‘old school’ way to collect investments might seem especially attractive in the context of mass adoption trends and a declining ICO market, which now sees its hardest slump in 16 months.

Using Cointelegraph's tag for technical analysis, Price Analysis, I'll point to a sample article from mid-month:-

The language in that analysis is decidedly negative. In the initial survey, it quotes a sector expert saying,

Bitcoin will resurge in 2019 but altcoins "will never come back."

The phrases 'bearish patterns', 'trend remains down', 'breakdown of the support zone', 'strong downtrend', and 'facing resistance' are used for the first five of the ten cryptocurrencies covered. The mania of 2017 is over.

15 September 2018

Bitcoin in the News : 2018-08 More++

After last month's price news, Bitcoin in the News : 2018-08 Price, what other bitcoin news made the headlines? In the corresponding 'Bitcoin in the News' analysis for July, 2018-07 More++, I featured stories from Forbes. In the analysis for June, 2018-06 More++, the spotlight was on CNBC. If I concentrated on those same sources for August, I would have twice as many stories from Forbes as from CNBC, making Forbes the blue ribbon service for bitcoin reporting and analysis.

For August, I noticed that the word 'scam' showed up in the headline for many stories. [For an explanation of how I choose the stories, see the first post in the series, Bitcoin in the News - June 2015 (December 2015)] The number of days where 'scam' appeared at least once was more than double an average month and beat the previous record, set in March 2017.

Looking closer at the days with 'scam' stories, I discovered that a few of them came from news alerts on the term 'botnet', another topic that I follow regularly. Following is an example of the several stories involving a high tech combination of a cryptocurrency, a botnet, and Twitter.

2018-08-06: Duo Security researchers’ Twitter ‘bot or not’ study unearths crypto botnet (techcrunch.com) • 'A team of researchers at Duo Security has unearthed a sophisticated botnet operating on Twitter -- and being used to spread a cryptocurrency scam. The botnet was discovered during the course of a wider research project to create and publish a methodology for identifying Twitter account automation -- to help support further research into bots and how they operate.' • The report was illustrated by the following graphic. ETH is, of course, Ethereum.


'To celebrate 10,000,000$ worth of ETH transactions
We are giving back to the community with
*** 10,000 ETH giveaway ***
Send 0.5-10 ETH to verify your address, and get 5-100 ETH
back (limit is 100 ETH per address). Fav this tweet when you get yours!'

It's hard to believe that many people would fall for this. It's also hard for cryptocurrency outsiders to believe that so many people would fall for crypto. Greed is a powerful motivator. Following are a few more scams which popped up for August. I'll give enough excerpts to understand how the scams work.

2018-08-13: 22-year-old man loses $24 million worth of bitcoins in apparent scam (mashable.com) • 'In June 2017, Saarimaa was approached by a group who convinced him to send him the bitcoins, the report claims, quoting findings by Thailand's Crime Suppression Division's (CSD), which has been conducting an investigation into the case for six months. Saarimaa believed he was investing in shares of three companies, a casino and a new cryptocurrency called Dragon Coins, but after seeing no returns at all, his business partner Chonnikan Kaeosali filed a complaint to the CSD. As it turned out, the group converted the bitcoins into Thai currency, deposited it into accounts belonging to seven suspects, and spent some of it on plots of land.'

2018-08-23: US Federal Trade Commission Issues Warning on Bitcoin Blackmail Scam ‘Targeting Men’ (cointelegraph.com) • 'The Division of Consumer and Business Education of the U.S. Federal Trade Commission (FTC) published an article August 21 titled "How to avoid a Bitcoin blackmail scam." The FTC’s letter focuses on consumer protection, in what it calls a "new scam targeting men," warning about blackmailing scams demanding payments in Bitcoin (BTC). The brief letter states: "Here’s how it works. Scammers have been sending letters to men, demanding payments using [B]itcoin in exchange for keeping quiet about alleged affairs. The letter also explains how to use [B]itcoin to make the payment."'

2018-08-26: Indian Authorities Nab High-Profile Bitcoin Scammers (bitcoinist.com) • 'One common thing promised to all the investors was that they would be getting 10 percent returns on their total investments for the period of next 18 months. One of the accused is a motivator who encouraged and inspired the investors to put their money into Bitcoin. Initially, some of the investors also started getting some returns, which gave them false assurance that their money was safe.'

2018-08-27: 'Wolf of Wall Street' warns investors of the next big trap: Bitcoin (cnbc.com) • 'Former penny-stock broker Jordan Belfort spent nearly two years in prison for scamming investors. Bitcoin, he has no doubt, is the next trap that could leave some retail investors penniless. "I was a scammer. I had it down to science, and it's exactly what's happening with bitcoin," he told CNBC in a documentary airing Monday. "The whole thing is so stupid, these kids have gotten themselves so brainwashed."'

Greed, gullibility, and high technology. That's all it takes to fall victim to a scam. There were several other stories that could have been featured in this post. I'll give two, one each from CNBC and Forbes. Both appeared around the time of the low point in the August price.

I have other August stories on my short list that contradict both of the above. When all is said and done, we're on our own with our beliefs.