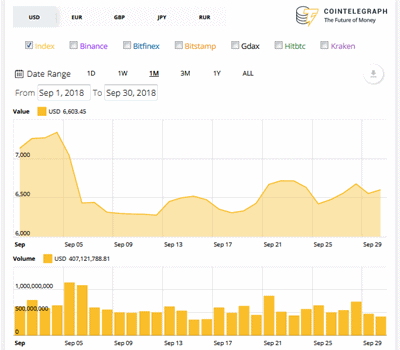
Since February, the Cointelegraph price service has offered the possibility of entering a from-to date range. I set this to 1 September through 30 September and received the chart shown below. The data granularity for a specified date range appears to be a full day; the granularity of the monthly chart appears to be six hours. That accounts for the difference in the look of the chart.
None of the stories in Cointelegraph's Analysis category attempted to explain the drop at the beginning of the month. Of the 30 or so stories in the category, one in particular caught my attention:-
- 2018-09-11: The Crypto IPO Race Is On: From Mining Companies to Exchanges • 'Last week, at least two crypto-related enterprises, a Silicon Valley stock and cryptocurrency trading platform Robinhood and Singapore-based crypto exchange Huobi, moved closer to going public by holding an initial public offering (IPO).' The ‘old school’ way to collect investments might seem especially attractive in the context of mass adoption trends and a declining ICO market, which now sees its hardest slump in 16 months.
Using Cointelegraph's tag for technical analysis, Price Analysis, I'll point to a sample article from mid-month:-
The language in that analysis is decidedly negative. In the initial survey, it quotes a sector expert saying,
Bitcoin will resurge in 2019 but altcoins "will never come back."
The phrases 'bearish patterns', 'trend remains down', 'breakdown of the support zone', 'strong downtrend', and 'facing resistance' are used for the first five of the ten cryptocurrencies covered. The mania of 2017 is over.

No comments:
Post a Comment