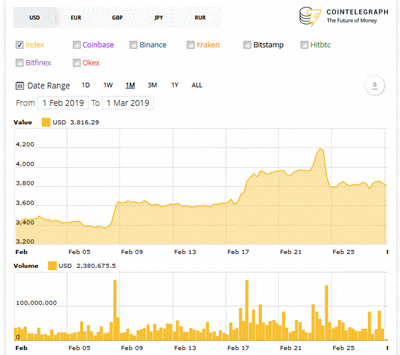
For the first month in a long time the number of stories about bitcoin price seemed less than the number of other stories. I would 'bet' that's a positive sign. Markets tend to rise gradually when they are out of the spotlight.
This month the price stories were back on top, perhaps because it was an overall positive month for bitcoin. There was a one week period during the month that I described in the 2019-02 Price post as 'jump-flat-jump-drop'. This occurred during the week 2019-02-17 through 2019-02-24. I looked at one reliable source for stories covering that period and found four:-
- 2019-02-19: Bitcoin Price Crosses Key Long-Term Hurdle For First Time in 4 Months (coindesk.com) • 'Bitcoin has passed through the 100-day moving average for the first time in 127 days. ... However, price action has stalled Tuesday, as indecision brings the possibility of a pullback.'
- 2019-02-20: Bitcoin Price Looks North As Trading Volumes Hit 9-Month Highs (ditto) • 'Bitcoin witnessed an inverse head-and-shoulders breakout on Monday and rose to $4,000 yesterday, confirming a bullish reversal on the daily chart. The trend change is backed by a jump in trading volumes to levels last seen in May 2018.'
- 2019-02-25: Bitcoin Shorts Dropped to 11-Month Lows During Sunday's Sell-Off (ditto) • 'The development comes just a week after the total value tied up in all short trades on the exchange reached a six-month low, one of a number of signs that would suggest investors are losing confidence in the idea that bitcoin’s price will further decrease.'
- 2019-02-27: Bitcoin Price On Track to End Six-Month Losing Streak (ditto) • 'Bitcoin appears on track to snap its six-month losing streak and close February in the green for the fifth consecutive year. BTC may remain better bid in March, as the weekly chart is signaling bearish exhaustion.'
Those analyses are all technical and say little about the long term trend. On another of my favorite sources I found an article that gave some fundamental analysis.
- 2019-02-23: Bitcoin Is Rocketing Higher -- Here's Why (forbes.com) • 'Bitcoin has again shot past $4,000 per bitcoin, giving fresh hope to long-suffering investors who have been stuck in a bear market for over a year -- the second weekend in a row the bitcoin price has rallied.'
The analytical points were summarized in a single sentence.
Bitcoin's sudden price leap comes after a week of positive bitcoin news, with the confirmation of Samsung's latest crypto-wallet supporting phone, tech billionaires talking bitcoin up, and approaching network upgrades [Ethereum].
Billionaires can say what they want to serve whatever purpose and network upgrades happen frequently, but that first point might have long-term significance. Here is a more detailed story:-
- 2019-02-21: Don't Underestimate Samsung Galaxy S10's Crypto Offering, Millions Will Be Exposed To Bitcoin (newsbtc.com)
Today the only purpose bitcoin serves is as an unconventional vehicle for speculating. If it could serve a real need, like paying for real stuff, it might acquire real importance.
