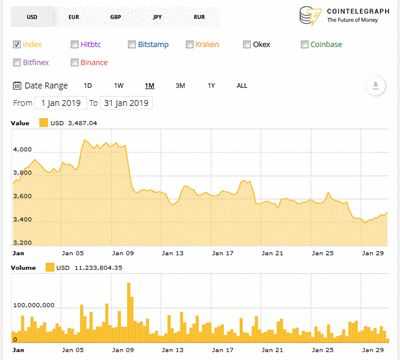
Bitcoin (BTC) Price Index
(cointelegraph.com)
If last month's chart looked like a roller-coaster, this month's looks more like a carousel. Except for that plateau between 5 January and 9 January, the trend for the month was a gentle but steady downward fall.
As usual, Cointelegraph's Analysis category carried no analysis of the curious pattern. The stories before, during, and after the bump could have appeared on any other day of the month:-
- 2019-01-05: ICO Market 2018 vs 2017: Trends, Capitalization, Localization, Industries, Success Rate
- 2019-01-07: Japanese Banks Launching Digital Currencies Could Inspire the Traditional Cash Society
- 2019-01-09: From Bitconnect to SIM-Swap Swindling: 2018's Biggest Scams
The site's Price Analysis tag likewise offered little explanation:-
- 2019-01-11: Bitcoin, Ripple, Ethereum, Bitcoin Cash, EOS, Stellar, Litecoin, Tron, Bitcoin SV, Cardano: Price Analysis • 'While the most recent fall shows that the sentiment is still fragile, a strong rebound from the current levels would indicate that there is demand on the dips, a markedly bullish sign. However, if the cryptocurrencies instead plummet to new lows, it would be a bearish sign.'
In other words, 'a strong uptrend will be positive, a strong downtrend will be negative'. So what does a gentle downtrend say?
No comments:
Post a Comment