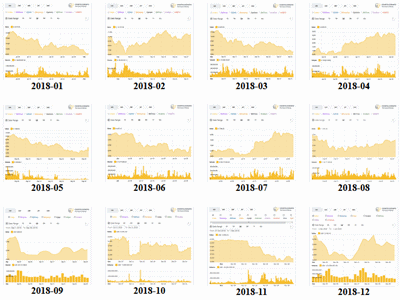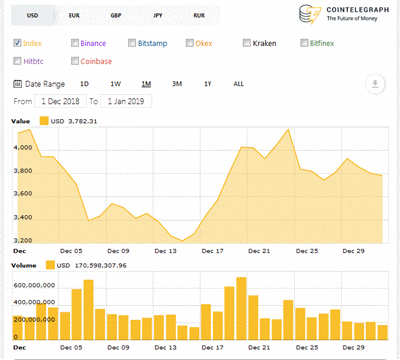
I count six different months where the price retreated during the entire month. Good thing I have this yearly price overview to fall back on, because almost all of the bitcoin stories flagged during the month of December were about price. Take the following story, for example, which appeared at the beginning of the month:-
- 2018-12-01: Bitcoin, and Cryptocurrency in General, Had a Terrible November (gizmodo.com) • 'Bitcoin, as well as smaller cryptocurrencies like XRP [Ripple] and ether, had a terrible November that saw $70 billion in value wiped off the market, CNBC reported on Friday. Bitcoin closed at $3,878, well below $6,000, which proponents had long insisted was its "floor" but in retrospect appears to have been a magic number.'
Also in retrospect, I can say that all bitcoin future price projections are based on 'magic numbers'. In 2017, they were fantastic price targets sometimes getting into six figures USD. In 2018, they were floors, always new, always lower. The only real floor is $0.00, about which there were more than a few articles in December. Opinions varied:-
- 2018-12-05: Why bitcoin -- by design -- won’t become worthless, according to this crypto heavyweight (marketwatch.com) • 'Bitcoin protocol is set up to be adjusted as mining conditions worsen, says teaching fellow Andreas Antonopoulos.'
- 2018-12-16: Famed crypto millionaire says Bitcoin is dead (techspot.com) • 'A famous early investor [Erik Finman] who made millions from Bitcoin has warned that the best-known cryptocurrency of them all is "dead."'
- 2018-12-23: A VC Thinks Bitcoin Passed A Major Milestone This Year (forbes.com) • 'Bitcoin has crossed a major milestone this year, with its chances of falling to zero almost non-existent.'
- 2018-12-26: Does Bitcoin Have a Future? (coincentral.com) • 'Whenever a major financial market struggles for survival in a deep, enduring bear market, undertakers with access to the financial press gleefully pronounce its imminent demise. For Bitcoin, such dire pronouncements have been arriving at a steady pace since summer 2018.'
Another recurring theme in December was to mark an ignominious anniversary. Here's an example from one of my favorite writers at Yahoo Finance.
- 2018-12-17: It's been one year since bitcoin was interesting (yahoo.com; Myles Udland) • 'It was exactly one year ago today -- December 17, 2017 -- that the price of bitcoin hit a record high of $20,000 per bitcoin.'
In fact, the peak price was somewhat short of $20,000, but that's little consolation to anyone who actually bought at that price. Finally, let's not forget that this sort of thing has happened before.
- 2018-12-11: The Biggest Rises and Falls of Bitcoin, Explained (cointelegraph.com) • '1. November 2011; 2. November 2013; 3. April 2013; 4. December 2017; 5. November 2018'
Have we seen capitulation in the bitcoin market? I found two definitions on Investopedia.com:-
If we have seen capitulation, then we have seen the bottom. We'll find out in a year or so if that was in the case. As for me, I'll continue to do exactly what I always do : watch and learn. I'll learn nothing from capitulation.
