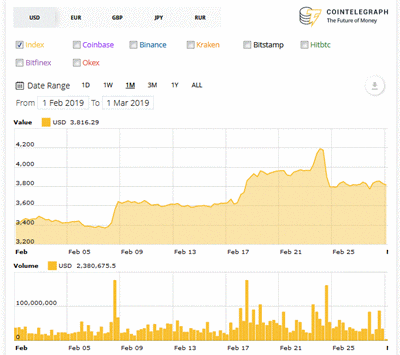
The approximate times of the jumps and drop and the corresponding price movements were something like this:-
2019-02-08 06:00 3400 > 3600 +
2019-02-17 18:00 3600 > 3900 +
2019-02-23 06:00 4000 > 4200 +
2019-02-24 06:00 4200 > 3800 -
The individual patterns are all similar: the market is in a state of equilibrium, then something happens -- always accompanied by significant volume -- to move it quickly to another state of equilibrium. The cycle repeats. What is happening to provoke the change in the level of equilibrium?
Cointelegraph's Analysis category offered nothing on the subject. The site's Price Analysis tag had one summary that looked like an explanation:-
The italics are mine:-
A bottom formation after a long bear market is not a linear process. At various intervals, we are likely to witness spurts of buying and selling as the bulls and the bears attempt to establish their supremacy. After a smart recovery from the lows, when it looked like the bears had surrendered, came the plunge on Feb. 24, that wiped off about $15 billion from the total market capitalization within a few minutes.
Such selling is not always based on fundamental news or events. Technical factors like profit booking near a stiff resistance and initiation of short positions by aggressive bears can bring about such a sharp fall.
That analysis describes coordinated actions. How are the actors ('the bulls and the bears') communicating with their like-minded counterparts?

No comments:
Post a Comment