09 February 2019

Bitcoin in the News : 2019-01 More++

In the first post this month, Bitcoin in the News : 2019-01 Price, I noted,
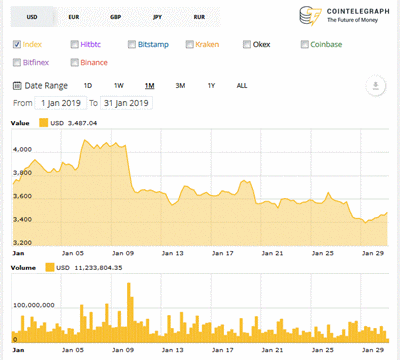
Except for that plateau between 5 January and 9 January, the trend for the month was a gentle but steady downward fall.

Looking at that 'plateau' a little closer, I see a steady price around $3800, followed by a sharp jump to $4000 which holds for a few days, followed by a sharp drop to $3600 which is the real start point for the 'steady downward fall'. I found two stories from the same source that bracket the plateau. Here's the first:-

  • 2019-01-07: The Bitcoin Price Has Leaped Sharply Higher -- Here's Why (forbes.com) • 'Just ahead of the bitcoin market spike last night a bitcoin whale moved some 2,500 bitcoin (worth just under $10 million) on the Luxembourg-based Bitstamp exchange, according to the Twitter price tracking bot Whale Alert. The move pushed the daily bitcoin volume up to over $5 billion, a 2019 high.'

It's not clear how a 'move' (is that a buy or a sell?) of $10 million results in a total of $5 billion, but I'm here to learn. The other side of the plateau was explained in a second story:-

So someone published 'market research' about 'a decline in investor sentiment' and everyone rushed for the exit? Later the same story mentioned,

Robust Twitter Activity: Before the widespread declines in digital currency markets, the top digital currencies experienced a greater number of tweets. [...]

Technical Analysis: While analyzing social media activity can help grant insight into the sentiment of traders, it is not the only tool that can be helpful in this respect. Technical analysis can also help shed some light on sentiment by looking at key market activity.

This confirms my current understanding of bitcoin price action. Since the cryptocurrency has no tangible underlying value, its price movement is driven entirely by 'investor' (a better word might be 'speculator') psychology.

[As an aside, the previous story looked like this on my screen...

...The real story occupies less than 25% of the screen space. The large ad in the top half starts to repeat in the lower right (it's in Dutch because I live in the Flemish region of Belgium) and the blue rectangle is a video. When I scroll down, the video switches to the lower left and follows my scrolling while the ad 'Fysiek Goud Kopen' ('Buy Real Gold') slides down the right side of the screen. Quel horreur!]

That little detour gives me an excuse to introduce the next theme: the number of stories that mentioned gold. The number of January bitcoin stories flagged by 'Google News' alerts was more than double the number in December, and more than any previous month. I saw from this little analysis that the bitcoin/gold connection has always been a recurring theme. Here are three stories that made my short list for the month:-

That third story references the first, making it clear where the theme started. The word 'bet' at the end of the next quote is appropriate:-

At the forefront of the bitcoin vs. gold movement are Cameron and Tyler Winklevoss, the founders of New York-based crypto exchange and custodian of Gemini Trust Co. The twins argue that bitcoin’s fungibility and divisibility -- thanks to its fixed and known supply -- make it a better bet than gold.

One more theme for the month is worth a mention. Three months ago, in Bitcoin in the News : 2018-10 More++ (November 2018), I quoted Reuters: 'Bitcoin ... celebrates its tenth birthday on Wednesday [31 October]'. Now I learn:-

There were other January stories I could flag, but I'll stop here. In fact, for the first month in a long time the number of stories about bitcoin price seemed less than the number of other stories. I would 'bet' that's a positive sign. Markets tend to rise gradually when they are out of the spotlight.

02 February 2019

Bitcoin in the News : 2019-01 Price

Last month's post, Bitcoin in the News : 2018-12 Price, displayed the last monthly price chart for 2018. This post shows the first chart for 2019.


Bitcoin (BTC) Price Index (cointelegraph.com)

If last month's chart looked like a roller-coaster, this month's looks more like a carousel. Except for that plateau between 5 January and 9 January, the trend for the month was a gentle but steady downward fall.

As usual, Cointelegraph's Analysis category carried no analysis of the curious pattern. The stories before, during, and after the bump could have appeared on any other day of the month:-

The site's Price Analysis tag likewise offered little explanation:-

In other words, 'a strong uptrend will be positive, a strong downtrend will be negative'. So what does a gentle downtrend say?

12 January 2019

Bitcoin in the News : 2018-12 More++

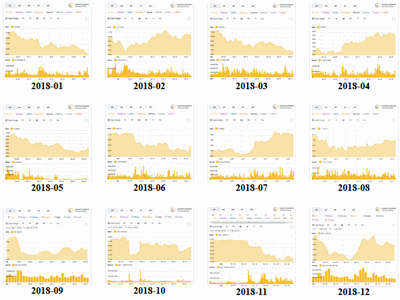
Just like every month over the past year, a monthly 'More++' post follows a monthly 'Price' post -- in this case, the preceding post was Bitcoin in the News : 2018-12 Price. And just like last year's January post, Bitcoin in the News : 2017-12 More++, I'll summarize all of last year's monthly price charts in a single chart.

I count six different months where the price retreated during the entire month. Good thing I have this yearly price overview to fall back on, because almost all of the bitcoin stories flagged during the month of December were about price. Take the following story, for example, which appeared at the beginning of the month:-

  • 2018-12-01: Bitcoin, and Cryptocurrency in General, Had a Terrible November (gizmodo.com) • 'Bitcoin, as well as smaller cryptocurrencies like XRP [Ripple] and ether, had a terrible November that saw $70 billion in value wiped off the market, CNBC reported on Friday. Bitcoin closed at $3,878, well below $6,000, which proponents had long insisted was its "floor" but in retrospect appears to have been a magic number.'

Also in retrospect, I can say that all bitcoin future price projections are based on 'magic numbers'. In 2017, they were fantastic price targets sometimes getting into six figures USD. In 2018, they were floors, always new, always lower. The only real floor is $0.00, about which there were more than a few articles in December. Opinions varied:-

Another recurring theme in December was to mark an ignominious anniversary. Here's an example from one of my favorite writers at Yahoo Finance.

In fact, the peak price was somewhat short of $20,000, but that's little consolation to anyone who actually bought at that price. Finally, let's not forget that this sort of thing has happened before.

Have we seen capitulation in the bitcoin market? I found two definitions on Investopedia.com:-

If we have seen capitulation, then we have seen the bottom. We'll find out in a year or so if that was in the case. As for me, I'll continue to do exactly what I always do : watch and learn. I'll learn nothing from capitulation.

05 January 2019

Bitcoin in the News : 2018-12 Price

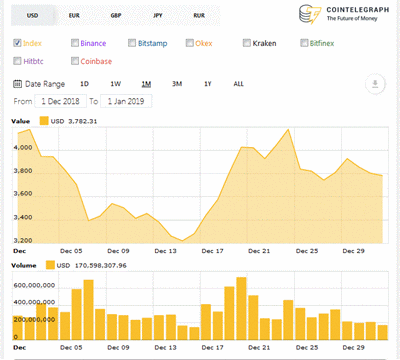
The chart for December (shown below) has a different look than the chart in last month's post, Bitcoin in the News : 2018-11 Price. When I asked Cointelegraph for a one-month chart, it gave me a three-month chart; when I asked for a three-month chart, it game me a chart covering the entire life of bitcoin (not a pretty chart). I specified a date range, as I did for Bitcoin in the News : 2018-09 Price (October 2018), and where I remarked,
The data granularity for a specified date range appears to be a full day; the granularity of the monthly chart appears to be six hours. That accounts for the difference in the look of the chart.

Anyway, here's the chart for December 2018.


Bitcoin (BTC) Price Index (cointelegraph.com)

The chart shows a painful drop from $4200 to $3200 during the first half of the month, bottoming at mid-month. That was followed by a sharp one week rise leading to a gentle decline that lasted into the new year.

Cointelegraph's Analysis category made no attempt to explain any of those three trends, focusing instead on stories like From Blanket Ban to Its Own Stablecoin: How Facebook’s Relationship With Crypto Changed Over 2018, which was the last article in the category for the year 2018. Cointelegraph's Price Analysis tag had three stories that coincided with the three stages in the month's chart:-

The analysis continued with a cautious prognostication:-

A year later, after a massive bear market, the question in every investor’s mind is, can Bitcoin rise from the dead once again and stage a turnaround? While we believe that Bitcoin is closer to a bottom than ever, we do not expect a sharp rally from current levels. There is a huge overhang of positions that will liquidate when the virtual currency attempts a recovery. Hence, it will be a slow and laborious move higher.

This forecast was based on a plausible scenario:-

Fundamental factors like actual utility, clear regulations and wider adoption of the technology will attract institutional investors who will drive the next leg up. All of this will require time and will not happen overnight.

The second stage was that one week runup:-

  • 2018-12-24: Bitcoin, Ripple, [etc...]: Price Analysis, Dec. 24 • 'Christmas has brought some cheer to the crypto traders. The total crypto market capitalization has spiked by about 29 percent from just under $101 billion on Dec. 15 to $143 billion on Christmas Eve. Though it is still way below its all-time-high, the growth over the past few days is showing signs of a bottom formation.'

The situation mid-month could indeed have been a bottom. Looking back at the previous monthly charts for 2018, there was no other month that looked like December. The analysis covering the third stage was:-

Have excesses been removed? The year 2018 ended with a bitcoin price four times greater than at yearend 2016.

I have one more small analysis to make before I close this post. In the '2018-11 Price' post, I noted,

Back to the November chart, I noticed that there are three additional price sources available over what was shown in the '2018-10 Price' post.

Here's a similar analyis for the December chart, which also shows changes.

(A : 2018-11 Price) Index, Bitstamp, Bitfinex, Hitbtc, Huobi, Poloniex, Kraken, Binance, Okex, Coin

(B : 2018-12 Price) Index (A1), Okex (A9), Binance (A8), Bitstamp (A2), Kraken (A7), Bitfinex (A3), Hitbtc (A4), Coinbase (A10?)

Ten price sources end-November dropped to eight sources end-December. Huobi and Poloniex disappeared, after appearing for the first time end-November. One of the differences, Coin/Coinbase, was due to an error on my part, not noticing a slider. If that was the only error I made in the previous post, I'll consider myself lucky.

15 December 2018

Bitcoin in the News : 2018-11 Deeper

In my first 'Bitcoin in the News' post this month, 2018-11 Price, I noticed 'three distinct downward price shifts' and identified their start times. In my second post, 2018-11 More++, I collected November stories from two mainstream financial news services, CNBC and Forbes, with an eye on finding an explanation for the price drops. For this third post, I located three stories from each service that were published around the time of the drops.

CNBC:-

All three stories were by Kate Rooney, 'Markets Reporter'.

Analysts attributed bitcoin's continued sell-off to technical levels and stop orders in the market kicking in after bitcoin fell below $6,000. "The next logical level of support is at $5,000 but if that doesn't hold, the next logical support level isn't until $3,500," eToro analyst Mati Greenspan said in a note to clients Monday. "With all the falling prices lately, this definitely fits the definition of a buyers market."

$5000 didn't hold; $3500 didn't hold. As I write this, mid-December, the bitcoin price is around $3250. Those 'support levels' turned out to be imaginary. As for 'buyers market', that assumes there is real value in cryptocurrency. The article continued,

Others pointed to a split in the cryptocurrency bitcoin cash. That digital currency split into two versions last week -- "Bitcoin ABC" and "Bitcoin SV" -- which analysts said added to uncertainty in broader crypto markets.

U.S. regulators made good on promises to regulate non-compliant cryptocurrency projects last week. The Securities and Exchange Commission announced its first civil penalties against crypto founders Friday as part of a bigger regulatory and legal crackdown aimed at abuses and outright fraud in the growing digital currency industry.

The 'bitcoin cash' fork/split argument is the tail wagging the dog. The 'regulators' argument is plausible, but the threat has been there since shortly after the invention of bitcoin. Why would a crackdown on dubious crypto players affect the price of established currencies?

Some analysts blamed a "fork" in the cryptocurrency bitcoin cash for that initial drop below $6,000. That digital currency split into two versions in mid-November and diverted what's known as "hash power," which some say dragged down the broader crypto markets. Both sides appeared to be selling bitcoin to "fund mining operations to win the battle," Brian Kelly, CEO of BKAM, told CNBC. The $6,000 level could have been a key exit point for some traders. Bitcoin going below it likely triggered "stop losses" which could have exacerbated the selling. Those bitcoin support levels were broken as the cryptocurrency continued to hit lower lows.

Regulatory crackdowns have also weighed on prices.

Fork, stop losses (= support levels), regulatory crackdowns. Same old, same old?

These lower lows are marking key exit points for some traders. Bitcoin going below $4,000 likely triggered "stop losses", predetermined trading levels that often exacerbate the selling. Those bitcoin support levels were broken as the cryptocurrency plunged to new lows.

In recent weeks, regulatory crackdowns have also weighed on prices. The Securities and Exchange Commission announced its first civil penalties against cryptocurrency founders last week as part of a wide regulatory and legal crackdown on fraud and abuses in the industry.

Last week, Bloomberg News reported that regulators are investigating whether bitcoin's rally to almost $20,000 last year was the result of market manipulation. The U.S. Justice Department is investigating whether tether, a controversial cryptocurrency that founders say is backed 1:1 by the U.S. dollar, was used by traders to prop up bitcoin, according to the report, which cited three unnamed sources familiar with the matter.

The first two paragraphs are familiar territory, but that last paragraph deserves further investigation.

Forbes:-

It was not immediately clear what had triggered the sudden sell-off today but tensions in the bitcoin sector are high ahead of a fork of the bitcoin cash cryptocurrency, expected tomorrow. Bitcoin cash, which split from the original bitcoin blockchain last year, will tomorrow split in two again, creating a third cryptocurrency. The two digital currencies will go by the names Bitcoin ABC (core Bitcoin Cash) and Bitcoin SV (Satoshi’s Vision). Bitcoin cash has been highly volatile in the run up the fork, rising as much as 50% over the last few weeks before falling sharply more recently.

I have a small amount of bitcoin cash. In quantity, it is the same amount as my bitcoin, because I received it after last year's fork. In value, it is a small percentage of bitcoin, in the low single digits. I have trouble believing that it has any impact on the wider market.

Fundamentally speaking, the current sell-off is due to two main reasons; regulatory pressure and disagreement within the coin developer community, one of the biggest threats. The SEC reminded the crypto world that it has the final say over anything that smells like a security. The department issued civil penalties against two cryptocurrency companies because they failed to register initial coin offerings as securities. Investors will be given their refund and the firms will have to face fines. The fear is that the SEC may not stop here and might take similar action against several companies that adopted a similar path.

The community needs to stick together and work towards a more meaningful fork. This is because developers, on the one hand, try to convince the world that the supply is limited and, on the other hand, they keep looking at ways of triggering another kind of forks. Forking has become so common that it puts at risk the notion of limited supply altogether.

That last sentence implies that forking is equivalent to dilution. That makes some sense, but it still doesn't explain how a problem with bitcoin cash (BCH) spills over into bitcoin (BTC) or the other cryptocurrencies.

The bitcoin price falls over the weekend do not appear to be linked to any particular fresh news but a continuation of the sell-off sparked earlier this month by the fork of the bitcoin cash cryptocurrency that ignited a civil war between the bitcoin rival's two factions. Low trading volumes over the holiday weekend, however, mean the market is more vulnerable to so-called "whales" moving large amounts of bitcoin, ripple (XRP), or ethereum. When a major coin holder sells it can trigger automatic computer controlled sell orders leading to sudden sell-offs.

After reading those stories, I looked at another article, also from Forbes, specific to the bitcoin cash fork.

Thursday was a volatile day on the cryptocurrency markets with Bitcoin Cash forking into two different currencies, BCHSV and BCHABC creating considerable hash wars which are ongoing.

That was the lead sentence, after which there were no further mentions of BCH. Instead there were a number of cheerleading statements from people whose destinies are tied to the crypto markets. The writer of the story closed by saying,

All very positive but what most of these people seem to forget is that the market has been sinking for a long time and absolutely no signs of an uptick are present. Price levels are, in many cases, 90% down from their all-time highs just a few months ago. Use cases are bountiful but is there any mass adoption going on out there? In most cases, it seems that cryptocurrencies and blockchain are being used in countries where the economy is totally broken, such as Venezuela and Palestine. Adding to the dubious prevalence of money laundering schemes and scams in eastern European countries such as Belarus (who incidentally are also legalizing cryptocurrencies), the future looks pretty bleak.

When I checked my account to see the quantity/value of BCH vs. BTC, I found three new currencies available for trading: 0x (ZRX), Basic Attention Token (BAT), and Zcash (ZEC). I looked at a few external pages to find out what they were, then bought a small quantity of each. The best way to learn about the crypto markets is by participating, although always with non-essential money.

Before closing this post, I looked at that mention of 'market manipulation' in the last CNBC story quoted above. I found another CNBC story linked from my '2018-11 More++' post, also by the same writer as the other three:-

As bitcoin continued its downward slide Tuesday, U.S. regulators are reportedly looking into whether its record-breaking rally last year was the result of market manipulation. The U.S. Justice Department is investigating whether traders used tether, a controversial cryptocurrency that founders say is backed 1:1 by a U.S. dollar, to prop up bitcoin, according to a report from Bloomberg News, which cited three people familiar with the matter.

As for the mechanics of how that might have happened, I will leave that for another time.

08 December 2018

Bitcoin in the News : 2018-11 More++

In last week's post, Bitcoin in the News : 2018-11 Price, I wrote, 'The month of November 2018 must show the worst chart for bitcoin during nearly two years.' I summarized the post with:-
When I look at the chart I see sideways price movement (= no movement) for the first half of the month, followed by three distinct downward price shifts. [...] These downward shifts can be roughly pegged to these start times:-
- 14 Nov 06:00
- 19 Nov 00:00
- 24 Nov 12:00

How to explain the drops? In separate 'Bitcoin in the News' posts a few months ago I highlighted two mainstream financial news services...

...by showing which stories had been published by the two news services. Let's do the same for November, comparing the stories from both services with the goal of understanding the November price movements. Of course, this isn't a comprehensive look at all of their stories -- it's a list of stories that were flagged by Google News, using whatever its criteria are.

CNBC:-

Forbes:-

Why are there more stories from Forbes? Because the service appears to have more writers covering the bitcoin++ topic. Since I have one extra Saturday this month to explore the topic, I'll use it to take a closer look at the relevant stories from both sources.

Before closing today's post, I have one more story to highlight. It's related to the first CNBC story, 'Bitcoin turns 10 years old':-

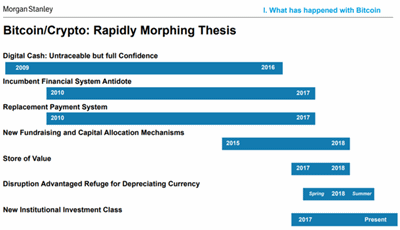
The story is based on a Morgan Stanley report and copied the following chart.


'The evolution of bitcoin'

From 'Digital Cash: Untraceable but full Confidence' (Ha!) to 'New Institutional Investment Class' (Huh?), the 'Bitcoin/Crypto' believers have been one chasing one elusive thesis after another.

01 December 2018

Bitcoin in the News : 2018-11 Price

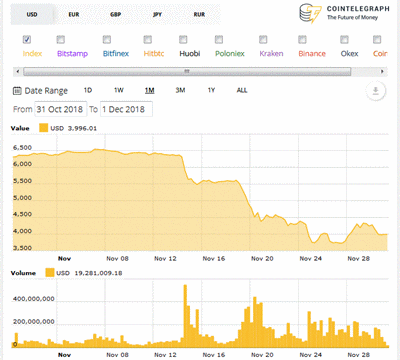
Next month, January 2019, will mark two years since I've limited this bitcoin blog to two posts per month, where the first post has been a chart of the previous month's price movements. The month of November 2018 must show the worst chart for bitcoin during the nearly two years.


Bitcoin (BTC) Price Index (cointelegraph.com)

When I look at the chart I see sideways price movement (= no movement) for the first half of the month, followed by three distinct downward price shifts. Using the same mouseover mechanism that I noted last month in Bitcoin in the News : 2018-10 Price, these downward shifts can be roughly pegged to these start times:-

  • 14 Nov 06:00
  • 19 Nov 00:00
  • 24 Nov 12:00

Looking at the stories in Cointelegraph's Analysis category (in which there are less than half the number of stories for October), only one story addresses (the first two of) the three drops.

2018-11-22: What Is Going On With the Crypto Markets, Analysts Unpack Factors Behind 10-Days Slump • 'Over the last 10 days the cryptocurrency markets have endured a massive sell-off across the board. There are a number of reasons that have led to the highly bearish sentiments on the market but seeing red has been difficult for many. As the value of Bitcoin and numerous altcoins have continued to decline to depressing levels, and a certain amount of panic has ensued.'

A graph of 'Total Market Capitalization' (of what, exactly, isn't clear) shows the market cap going from just over $200B to $150B starting 14 November. The first discussion in the story reduces to:-

'Main factors to consider' : Bitcoin Cash fork, Regulatory pressures, Global pressures (e.g. Brexit)

The other discussions are:-

'“Does this mean Bitcoin is broken? No”', 'Low trade volumes and high uncertainty', and 'A short term outlook'

The 'Bitcoin is broken?' section shows indices for three major American equity markets, all dropping lower on 20 November in tandem. All in all, none of these discussions is particularly revealing and I'm not convinced that this 'What Is Going On' story is anything deeper than cheerleading. Under Cointelegraph's Price Analysis tag, I found three stories coinciding with the drops.

2018-11-14: Bitcoin, Ethereum, Ripple, Bitcoin Cash, EOS, Stellar, Litecoin, Cardano, Monero, TRON: Price Analysis, Nov. 14 • 'Major cryptocurrencies have seen major losses today after months of stability, with Bitcoin reaching a new low for 2018.'

2018-11-19: Bitcoin, Ripple, Ethereum, Stellar, EOS, Litecoin, Cardano, Monero, TRON, IOTA: Price Analysis, Nov. 19 • 'Following the increase in volatility and a renewed downtrend in markets, some analysts have projected abysmally low prices for Bitcoin.'

2018-11-26: Bitcoin, Ripple, Ethereum, Bitcoin Cash, Stellar, EOS, Litecoin, Cardano, Monero, TRON: Price Analysis, Nov. 26 • 'Rampant selling in recent weeks dragged total market capitalization from above $210 billion on Nov. 14 to just below $116 billion on Nov. 25.'

If I had the time, I would look at these analyses in more depth, but I'm again not convinced that I would find any real explanations. Maybe I'll find the time to look at them when I work on the second post this month, like last month's Bitcoin in the News : 2018-10 More++.

Back to the November chart above, I noticed that there are three additional price sources available over what was shown in the '2018-10 Price' post.

(A : 2018-10 Price) Index, Binance, Bitfinex, Bitstamp, Gdax, Hitbtc, Kraken

(B : 2018-11 Price) Index (A1), Bitstamp (A4), Bitfinex (A3), Hitbtc (A6), Huobi, Poloniex, Kraken (A7), Binance (A2), Okex, Coin

That brief (A/B) analysis shows that one source disappeared between (A) and (B), 'Gdax', and four were added. It might again be useful to look at these changes in more depth, but at least I've flagged the keywords for any future searches on this blog.