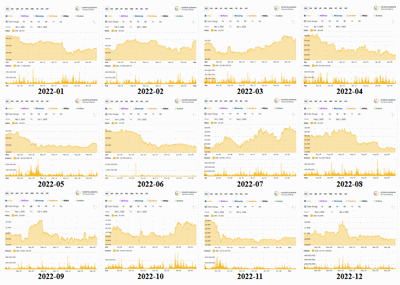
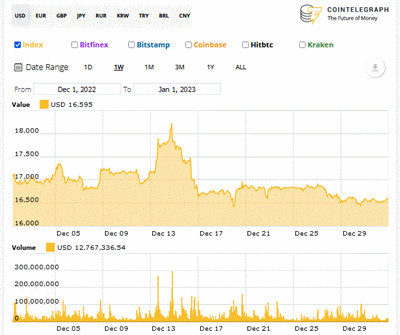
The first half of the post will be the annual composite chart showing the bitcoin price charts for all 12 previous months. The numbers are too small to read, but the year started with the price around $47.000 and ended at a little over $16.500.

It takes a lot of down months to lose almost two-thirds of value. It looks to me like six months were downers (Jan, Apr, May, Jun, Aug, Nov), three were uppers (Feb, Jul, Oct), and the other three were basically flat.
***
The second half of the post will be the usual '[TBD]', i.e. 'To Be Done', which isn't going to happen anytime soon. To repeat last year's 'Full Year' post:-
Q: Where to go with this blog? The last real post was 'The Halving' (May 2020). Since then I've been marking time with '[TBD]' posts. • A: After marking time for another year, I'll continue doing so for the time being. It forces me to pay attention to the crypto sector.
Copy that for 2023.
