Journal of a bitcoin explorer. Where will it lead? Keywords: cryptocurrency [crypto currency], blockchain [block chain], ledger, digital signature, cryptographic hash, Satoshi Nakamoto, mining, altcoin, crowdsourcing, consensus system.
Popular Posts (Last 7 Days)
14 September 2024
07 September 2024
Bitcoin in the News : 2024-08 Price
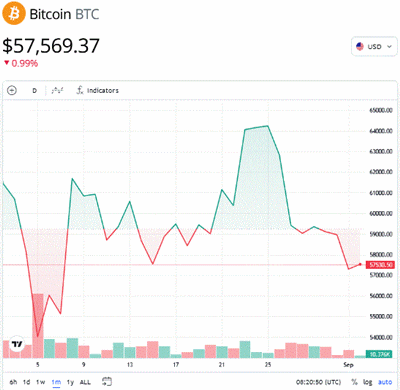
This month I missed my self-imposed deadline and created the chart on the second day of the month.
...once again I missed the deadline by a day for this month.
Last month I also wrote,
Since this is the first month with the new chart look, I'm not sure what to look for. Maybe next month it will make more sense.
The top half of the chart is green and the bottom half is red. The price separating green and red is the midpoint between the highest price on the chart and the lowest point.
The volume bars at the bottom of the screen have no numeric quantities associated with them; they are all relative to each other. At first I thought that the volume bars, coded green and red, correspond to a rising or falling price during that interval, but then I noticed some exceptions.
For example, the bar corresponding to 9 August is red and the price indeed fell over that interval. The bar to its right, however, is green but the price also fell over its interval. Maybe next month I'll spot the real meaning of green and red volume bars.
***
[TBD]
