10 May 2025

03 May 2025

12 April 2025
05 April 2025
08 March 2025
01 March 2025
08 February 2025
01 February 2025
11 January 2025
Bitcoin in the News : 2024 Full Year & 2024-12 More++
The first half of the post will be the annual composite chart showing the bitcoin price charts for all 12 previous months.
The chart source changed for June (2024-06).
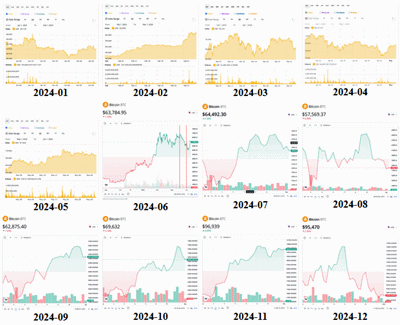
Since I wasn't yet familiar with the tools for the chart service, the chart for June is the full year starting August 2023. The vertical red lines in that chart mark the month of June.
***
[TBD]
04 January 2025
Bitcoin in the News : 2024-12 Price
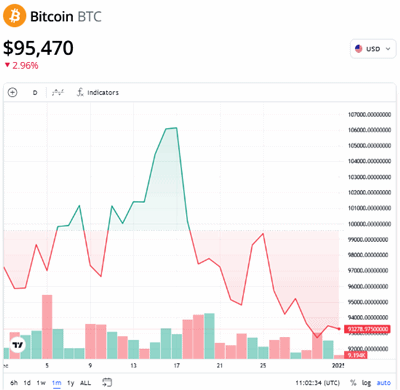
Bitcoin's price jumped from $69.632 on 1 November to $96.939 on 1 December. That's a rise of almost 40% in a month.
As the following chart shows, the price held for the month of December.
Next week I'll do a post on the price changes for the full year 2024.
***
[TBD]
14 December 2024
07 December 2024
Bitcoin in the News : 2024-11 Price
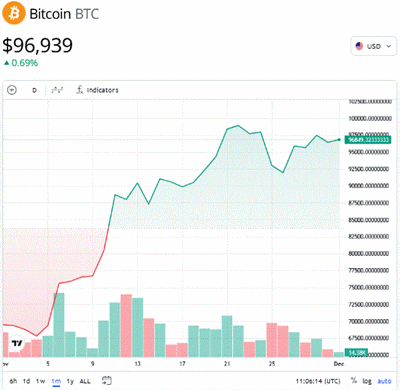
What was the reason for the rise? In a word: Trump. I should investigate the reason(s), but I'm afraid that -- as always -- I'll have to put it off until another time.
***
[TBD]
09 November 2024
02 November 2024
Bitcoin in the News : 2024-10 Price
Next month I'll look at some of the options on the chart.
First, here's the chart for October.
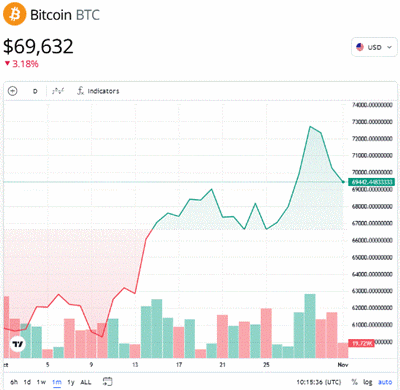
The upper left corner shows the current price & percent change (daily?) and is updated frequently. The upper right corner shows 'USD' and offers a total of 15 currencies.
Above the chart:-
- '+' : 'Compare or add symbol'
- '1h' : choice of three time periods
- formula : 12 options for chart type; default is 'Baseline'
- 'fx indicators' : around 100 'Indicators & strategies'
Below the chart:-
- choice of six time periods; default = 1 day (?)
- calendar icon : 'go to' date [incl. 'custom range']
- UTC time, updated every second
- three toggles for % / log / auto
In the bottom left of the chart is a small 'TV' icon. It links to TradingView - Track All Markets (tradingview.com).
Listing the options is just a start. Discovering what they do is the next step. The 'custom range' feature on 'go to date' might have been useful for the earliest charts when I forgot to take a snapshot at the beginning of the month, e.g. Bitcoin in the News : 2024-06 Price (July 2024). And what about those chart types and indicators?
***
[TBD]
12 October 2024
05 October 2024
Bitcoin in the News : 2024-09 Price
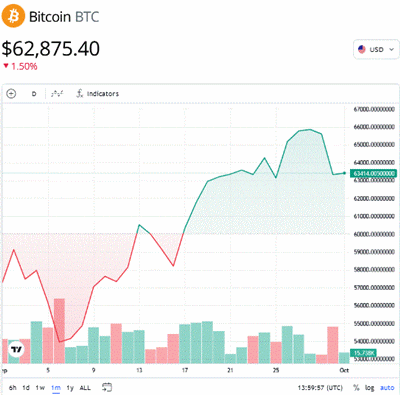
In last month's post Bitcoin in the News : 2024-08 Price (September 2024), I wrote,
At first I thought that the volume bars, coded green and red, correspond to a rising or falling price during that interval, but then I noticed some exceptions.
Since the exceptions are a small minority of the volume bars for a month, I now suspect that there is not perfect correspondence between the 24-hour periods covered by the price lines and those covered by the volume bars.
The small letters 'TV' in the lower left of the chart expand to 'Chart by TradingView'. Next month I'll look at some of the options on the chart.
***
[TBD]
14 September 2024
07 September 2024
Bitcoin in the News : 2024-08 Price
This month I missed my self-imposed deadline and created the chart on the second day of the month.
...once again I missed the deadline by a day for this month.
Last month I also wrote,
Since this is the first month with the new chart look, I'm not sure what to look for. Maybe next month it will make more sense.
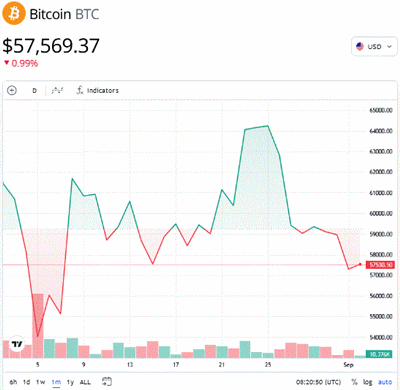
The top half of the chart is green and the bottom half is red. The price separating green and red is the midpoint between the highest price on the chart and the lowest point.
The volume bars at the bottom of the screen have no numeric quantities associated with them; they are all relative to each other. At first I thought that the volume bars, coded green and red, correspond to a rising or falling price during that interval, but then I noticed some exceptions.
For example, the bar corresponding to 9 August is red and the price indeed fell over that interval. The bar to its right, however, is green but the price also fell over its interval. Maybe next month I'll spot the real meaning of green and red volume bars.
***
[TBD]
10 August 2024
03 August 2024
Bitcoin in the News : 2024-07 Price
Next month I'll try to create the chart on the first day of the new month.
This month I missed my self-imposed deadline and created the chart on the second day of the month.
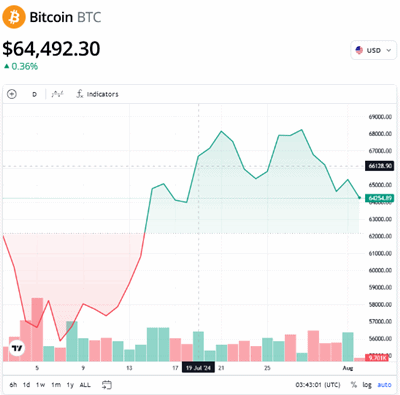
Since this is the first month with the new chart look, I'm not sure what to look for. Maybe next month it will make more sense.
***
[TBD]