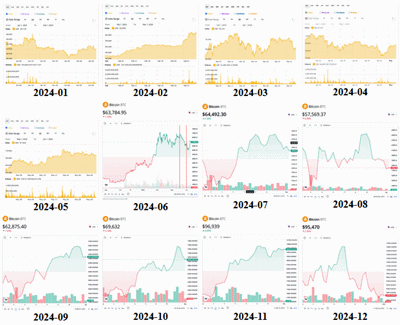
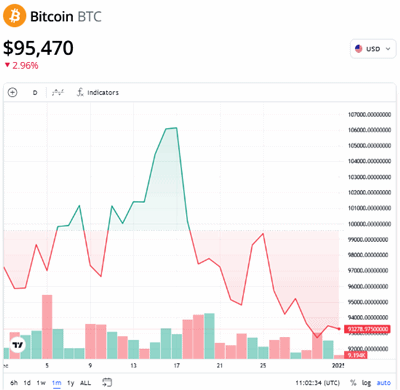
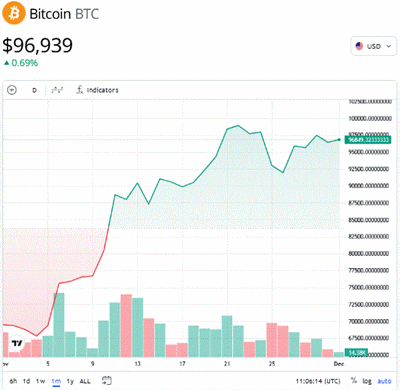
In last month's price post,
Bitcoin in the News : 2024-09 Price
(October 2024), I wrote,
Next month I'll look at some of the options on the chart.
First, here's the chart for October.
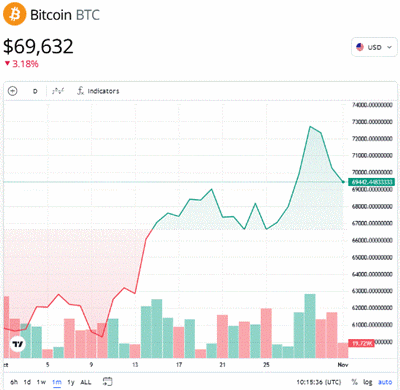
Bitcoin (BTC) Price Index
The upper left corner shows the current price & percent change (daily?) and is updated frequently.
The upper right corner shows 'USD' and offers a total of 15 currencies.
Above the chart:-
-
'+' : 'Compare or add symbol'
-
'1h' : choice of three time periods
-
formula : 12 options for chart type; default is 'Baseline'
-
'fx indicators' : around 100 'Indicators & strategies'
Below the chart:-
-
choice of six time periods; default = 1 day (?)
-
calendar icon : 'go to' date [incl. 'custom range']
-
UTC time, updated every second
-
three toggles for % / log / auto
In the bottom left of the chart is a small 'TV' icon. It links to
TradingView - Track All Markets
(tradingview.com).
Listing the options is just a start. Discovering what they do is the next step.
The 'custom range' feature on 'go to date' might have been useful for the earliest charts when I forgot to take a snapshot at the beginning of the month, e.g.
Bitcoin in the News : 2024-06 Price
(July 2024).
And what about those chart types and indicators?
***
[TBD]