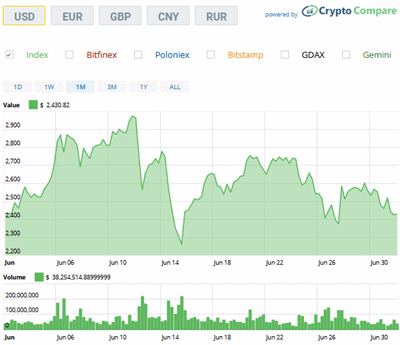
Once again, I turn to Bitcoin price analysis (cointelegraph.com) for an explanation of the price movement. The first story echoes the last story in the '2017-05 Price' post.
Then it was up, up, and away...
- 2017-06-05: Bitcoin Price Resilient to Economic Uncertainty, Hits $2,600 as Markets Plunge
- 2017-06-06: Bitcoin Price Hits New All-Time High at $2,933, Closing on $3,000
...in my beautiful balloon? So it would seem to some pundits.
- 2017-06-08: Bitcoin Price Can Reach $1 Mln: CNBC's Jim Cramer
- 2017-06-09: Bitcoin Price Will Hit $250,000 by 2020 If Seven-Year Trend Continues
Let's do the math. We'll eventually have 21 million bitcoins, which is 21 x 10^6. If each bitcoin is worth 1 x 10^6 USD, then the total value will be 21 x 10^12 USD, which is $21 trillion. Wikipedia, in Economy of the United States, informs,
The United States' GDP was estimated to be $18.46 trillion in 2016.
U.S. GDP is more than 20% of world GDP, so even then the math doesn't support Cramer's prediction. In any case, 3.000 is a long way from 1.000.000.
Note that all of the preceding commentary took place in the first half of the month. Then we had a sharp fall of 20% -- in a stable market that would be called a correction -- then a rebound that 'retraced' (another word commonly used in market analysis) 50 % of the loss. So what's next? Up or down, it's anyone's guess.
- 2017-06-24: Bitcoin Price Stabilizes at $2,700, Another Surge Imminent?
- 2017-06-24: Cryptocurrency Bubble Will Burst: Aberdeen Asset Management
The last week of the month saw a slide to the level we saw at the beginning of the month, but there were no further reports. Am I seeing a pattern here? The good news is reported; the bad news isn't. Or is this just my imagination playing tricks on me?

No comments:
Post a Comment