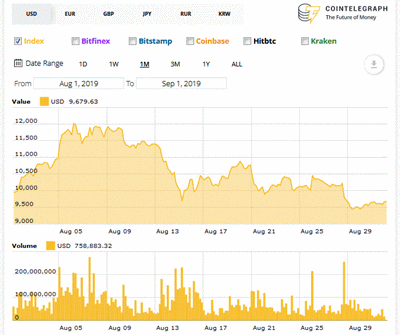
Another distinguishing factor in August was the number of volume spikes. I count six, where the top four are shown in the following table. The second and third occurred a half-day apart, so I'll treat them as a single spike.
2019-08-07 12:00
2019-08-14 16:00)
2019-08-15 04:00)
2019-08-28 16:00
As usual, Cointelegraph's Analysis category had nothing to offer on price movements -- either those listed above or any other. In a directionless period, what is there to say?
I also looked at pairs of reports under the site's Price Analysis tag -- one before and one after each of the three distinct volume spikes identified above. There was nothing about the associated price movements. For the first time I noticed that volumes aren't taken into account for the technical analysis used in the reports.
The upshot of all this is that I have nothing special to talk about this month. There was one change worth noting. The price chart for August shows two fewer exchanges than the chart in July: from seven exchanges to five. Binance and Okex are missing.

No comments:
Post a Comment