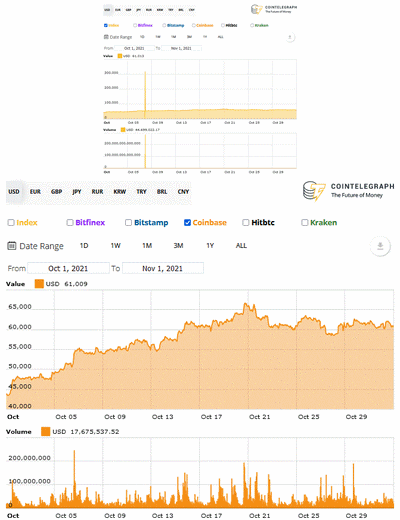
This month's price chart hit a glitch on 21 July. The usual 'Index' view showed a spike from 9000 to 16000 USD, followed by a quick return to 9000. The spike flattened the curve across the entire month, as shown in the top portion of the following image. The bottom portion is similar to the usual monthly chart, this time using a 'Coinbase' view.
It happened again this past month, with the price spiking from 54000 to 315000 USD around 8 October, then dropping. Last year I couldn't detect the source of the problem, but this time it showed up when the chart was isolated to 'Kraken'.
Another curiosity: if I extend the month to 'Nov 2, 2021', the spike disappears (and the granularity becomes coarser). If I shorten the month to 'Oct 31, 2021' the problem remains (with the granularity unchanged).
[TBD]
***
Another problem appeared this month, when the 'Bitcoin Price Widget' disappeared, sometimes being replaced by a Google ad. I'll see if I can fix it or find another price widget.

No comments:
Post a Comment