06 April 2019

Bitcoin in the News : 2019-03 Price

In last month's post, Bitcoin in the News : 2019-02 Price, I summarized the month's price chart with:-
The individual patterns are all similar: the market is in a state of equilibrium, then something happens -- always accompanied by significant volume -- to move it quickly to another state of equilibrium. The cycle repeats.

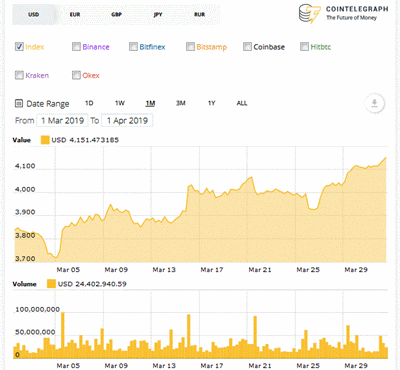
Although there were elements of that pattern in March, the chart was more like a steady ascent, punctuated by dips that corrected within a few days.

Bitcoin (BTC) Price Index

Since there were no dramatic price jumps or drops during the month, let's look at the volumes. I count three periods of heavy volume (each bar covers six hours) and I'll include a fourth near the end of the month to give me one heavy period per week. They occurred at the following (approximate) times:-

2019-03-05 12:00 +
2019-03-16 00:00 +
2019-03-21 12:00 -
2019-03-29 06:00 +

As usual, Cointelegraph's Analysis category provided no insight. The site's Price Analysis tag had nothing special to say, concentrating more on moving averages and resistance / support levels. Several 'Price Analysis' reports mentioned the Bakkt 'institutional trading platform'. Although the name wasn't completely new to me, I haven't mentioned it on this blog. The Bakkt.com home page says,

Bakkt is building an open, seamless global network to enable you to buy, sell, store and spend digital assets simply, safely and efficiently. Backed by Intercontinental Exchange’s proven financial market infrastructure and technology, Bakkt’s secure global platform will connect investors, merchants and consumers, making it easier, faster and more cost-effective to access, trade and use digital assets.

The main entry on Wikipedia is under Intercontinental Exchange ('! : reads like a press release or a news article'), where we learn,

Intercontinental Exchange (ICE) is an American company that owns exchanges for financial and commodity markets, and operates 12 regulated exchanges and marketplaces. This includes ICE futures exchanges in the United States, Canada and Europe...

The section titled 'Bakkt' says,

In August 2018 Intercontinental Exchange announced that it planned to form a new company, Bakkt, which is intended to leverage Microsoft cloud solutions to create an open and regulated, global ecosystem for digital assets. The new company will work with a marquee group of organizations [...] to create an integrated platform that enables consumers and institutions to buy, sell, store and spend digital assets on a seamless global network.

The Cointelegraph 'Price Analysis' reports implied that this will be a significant development in the evolution of crypto-currencies. I expect it will be heavily promoted when it's finally available.

09 March 2019

Bitcoin in the News : 2019-02 More++

One month does not signal a trend. In last month's 'More++' post, Bitcoin in the News : 2019-01 More++, I wrote,
For the first month in a long time the number of stories about bitcoin price seemed less than the number of other stories. I would 'bet' that's a positive sign. Markets tend to rise gradually when they are out of the spotlight.

This month the price stories were back on top, perhaps because it was an overall positive month for bitcoin. There was a one week period during the month that I described in the 2019-02 Price post as 'jump-flat-jump-drop'. This occurred during the week 2019-02-17 through 2019-02-24. I looked at one reliable source for stories covering that period and found four:-

  • 2019-02-19: Bitcoin Price Crosses Key Long-Term Hurdle For First Time in 4 Months (coindesk.com) • 'Bitcoin has passed through the 100-day moving average for the first time in 127 days. ... However, price action has stalled Tuesday, as indecision brings the possibility of a pullback.'
  • 2019-02-20: Bitcoin Price Looks North As Trading Volumes Hit 9-Month Highs (ditto) • 'Bitcoin witnessed an inverse head-and-shoulders breakout on Monday and rose to $4,000 yesterday, confirming a bullish reversal on the daily chart. The trend change is backed by a jump in trading volumes to levels last seen in May 2018.'
  • 2019-02-25: Bitcoin Shorts Dropped to 11-Month Lows During Sunday's Sell-Off (ditto) • 'The development comes just a week after the total value tied up in all short trades on the exchange reached a six-month low, one of a number of signs that would suggest investors are losing confidence in the idea that bitcoin’s price will further decrease.'
  • 2019-02-27: Bitcoin Price On Track to End Six-Month Losing Streak (ditto) • 'Bitcoin appears on track to snap its six-month losing streak and close February in the green for the fifth consecutive year. BTC may remain better bid in March, as the weekly chart is signaling bearish exhaustion.'

Those analyses are all technical and say little about the long term trend. On another of my favorite sources I found an article that gave some fundamental analysis.

  • 2019-02-23: Bitcoin Is Rocketing Higher -- Here's Why (forbes.com) • 'Bitcoin has again shot past $4,000 per bitcoin, giving fresh hope to long-suffering investors who have been stuck in a bear market for over a year -- the second weekend in a row the bitcoin price has rallied.'

The analytical points were summarized in a single sentence.

Bitcoin's sudden price leap comes after a week of positive bitcoin news, with the confirmation of Samsung's latest crypto-wallet supporting phone, tech billionaires talking bitcoin up, and approaching network upgrades [Ethereum].

Billionaires can say what they want to serve whatever purpose and network upgrades happen frequently, but that first point might have long-term significance. Here is a more detailed story:-

Today the only purpose bitcoin serves is as an unconventional vehicle for speculating. If it could serve a real need, like paying for real stuff, it might acquire real importance.

02 March 2019

Bitcoin in the News : 2019-02 Price

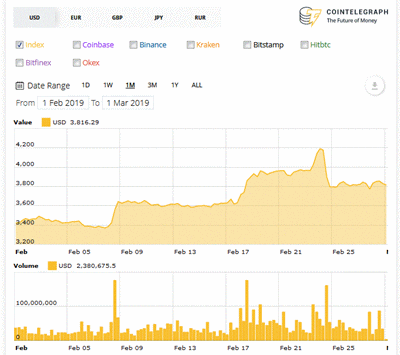
In last month's chart, Bitcoin in the News : 2019-01 Price, the pattern for the month was flat-jump-flat-drop-flat. This month's chart shows flat-jump-flat-jump-flat-jump-drop-flat.


Bitcoin (BTC) Price Index

The approximate times of the jumps and drop and the corresponding price movements were something like this:-

2019-02-08 06:00 3400 > 3600 +
2019-02-17 18:00 3600 > 3900 +
2019-02-23 06:00 4000 > 4200 +
2019-02-24 06:00 4200 > 3800 -

The individual patterns are all similar: the market is in a state of equilibrium, then something happens -- always accompanied by significant volume -- to move it quickly to another state of equilibrium. The cycle repeats. What is happening to provoke the change in the level of equilibrium?

Cointelegraph's Analysis category offered nothing on the subject. The site's Price Analysis tag had one summary that looked like an explanation:-

The italics are mine:-

A bottom formation after a long bear market is not a linear process. At various intervals, we are likely to witness spurts of buying and selling as the bulls and the bears attempt to establish their supremacy. After a smart recovery from the lows, when it looked like the bears had surrendered, came the plunge on Feb. 24, that wiped off about $15 billion from the total market capitalization within a few minutes.

Such selling is not always based on fundamental news or events. Technical factors like profit booking near a stiff resistance and initiation of short positions by aggressive bears can bring about such a sharp fall.

That analysis describes coordinated actions. How are the actors ('the bulls and the bears') communicating with their like-minded counterparts?

09 February 2019

Bitcoin in the News : 2019-01 More++

In the first post this month, Bitcoin in the News : 2019-01 Price, I noted,
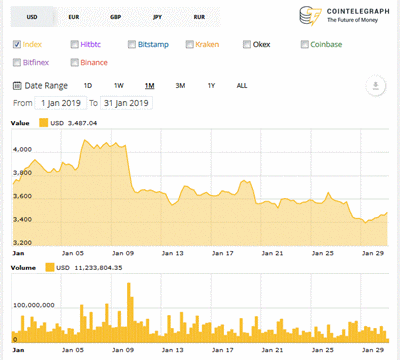
Except for that plateau between 5 January and 9 January, the trend for the month was a gentle but steady downward fall.

Looking at that 'plateau' a little closer, I see a steady price around $3800, followed by a sharp jump to $4000 which holds for a few days, followed by a sharp drop to $3600 which is the real start point for the 'steady downward fall'. I found two stories from the same source that bracket the plateau. Here's the first:-

  • 2019-01-07: The Bitcoin Price Has Leaped Sharply Higher -- Here's Why (forbes.com) • 'Just ahead of the bitcoin market spike last night a bitcoin whale moved some 2,500 bitcoin (worth just under $10 million) on the Luxembourg-based Bitstamp exchange, according to the Twitter price tracking bot Whale Alert. The move pushed the daily bitcoin volume up to over $5 billion, a 2019 high.'

It's not clear how a 'move' (is that a buy or a sell?) of $10 million results in a total of $5 billion, but I'm here to learn. The other side of the plateau was explained in a second story:-

So someone published 'market research' about 'a decline in investor sentiment' and everyone rushed for the exit? Later the same story mentioned,

Robust Twitter Activity: Before the widespread declines in digital currency markets, the top digital currencies experienced a greater number of tweets. [...]

Technical Analysis: While analyzing social media activity can help grant insight into the sentiment of traders, it is not the only tool that can be helpful in this respect. Technical analysis can also help shed some light on sentiment by looking at key market activity.

This confirms my current understanding of bitcoin price action. Since the cryptocurrency has no tangible underlying value, its price movement is driven entirely by 'investor' (a better word might be 'speculator') psychology.

[As an aside, the previous story looked like this on my screen...

...The real story occupies less than 25% of the screen space. The large ad in the top half starts to repeat in the lower right (it's in Dutch because I live in the Flemish region of Belgium) and the blue rectangle is a video. When I scroll down, the video switches to the lower left and follows my scrolling while the ad 'Fysiek Goud Kopen' ('Buy Real Gold') slides down the right side of the screen. Quel horreur!]

That little detour gives me an excuse to introduce the next theme: the number of stories that mentioned gold. The number of January bitcoin stories flagged by 'Google News' alerts was more than double the number in December, and more than any previous month. I saw from this little analysis that the bitcoin/gold connection has always been a recurring theme. Here are three stories that made my short list for the month:-

That third story references the first, making it clear where the theme started. The word 'bet' at the end of the next quote is appropriate:-

At the forefront of the bitcoin vs. gold movement are Cameron and Tyler Winklevoss, the founders of New York-based crypto exchange and custodian of Gemini Trust Co. The twins argue that bitcoin’s fungibility and divisibility -- thanks to its fixed and known supply -- make it a better bet than gold.

One more theme for the month is worth a mention. Three months ago, in Bitcoin in the News : 2018-10 More++ (November 2018), I quoted Reuters: 'Bitcoin ... celebrates its tenth birthday on Wednesday [31 October]'. Now I learn:-

There were other January stories I could flag, but I'll stop here. In fact, for the first month in a long time the number of stories about bitcoin price seemed less than the number of other stories. I would 'bet' that's a positive sign. Markets tend to rise gradually when they are out of the spotlight.

02 February 2019

Bitcoin in the News : 2019-01 Price

Last month's post, Bitcoin in the News : 2018-12 Price, displayed the last monthly price chart for 2018. This post shows the first chart for 2019.


Bitcoin (BTC) Price Index (cointelegraph.com)

If last month's chart looked like a roller-coaster, this month's looks more like a carousel. Except for that plateau between 5 January and 9 January, the trend for the month was a gentle but steady downward fall.

As usual, Cointelegraph's Analysis category carried no analysis of the curious pattern. The stories before, during, and after the bump could have appeared on any other day of the month:-

The site's Price Analysis tag likewise offered little explanation:-

In other words, 'a strong uptrend will be positive, a strong downtrend will be negative'. So what does a gentle downtrend say?

12 January 2019

Bitcoin in the News : 2018-12 More++

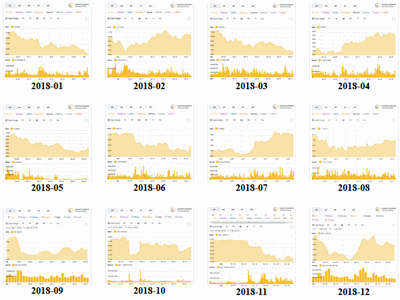
Just like every month over the past year, a monthly 'More++' post follows a monthly 'Price' post -- in this case, the preceding post was Bitcoin in the News : 2018-12 Price. And just like last year's January post, Bitcoin in the News : 2017-12 More++, I'll summarize all of last year's monthly price charts in a single chart.

I count six different months where the price retreated during the entire month. Good thing I have this yearly price overview to fall back on, because almost all of the bitcoin stories flagged during the month of December were about price. Take the following story, for example, which appeared at the beginning of the month:-

  • 2018-12-01: Bitcoin, and Cryptocurrency in General, Had a Terrible November (gizmodo.com) • 'Bitcoin, as well as smaller cryptocurrencies like XRP [Ripple] and ether, had a terrible November that saw $70 billion in value wiped off the market, CNBC reported on Friday. Bitcoin closed at $3,878, well below $6,000, which proponents had long insisted was its "floor" but in retrospect appears to have been a magic number.'

Also in retrospect, I can say that all bitcoin future price projections are based on 'magic numbers'. In 2017, they were fantastic price targets sometimes getting into six figures USD. In 2018, they were floors, always new, always lower. The only real floor is $0.00, about which there were more than a few articles in December. Opinions varied:-

Another recurring theme in December was to mark an ignominious anniversary. Here's an example from one of my favorite writers at Yahoo Finance.

In fact, the peak price was somewhat short of $20,000, but that's little consolation to anyone who actually bought at that price. Finally, let's not forget that this sort of thing has happened before.

Have we seen capitulation in the bitcoin market? I found two definitions on Investopedia.com:-

If we have seen capitulation, then we have seen the bottom. We'll find out in a year or so if that was in the case. As for me, I'll continue to do exactly what I always do : watch and learn. I'll learn nothing from capitulation.

05 January 2019

Bitcoin in the News : 2018-12 Price

The chart for December (shown below) has a different look than the chart in last month's post, Bitcoin in the News : 2018-11 Price. When I asked Cointelegraph for a one-month chart, it gave me a three-month chart; when I asked for a three-month chart, it game me a chart covering the entire life of bitcoin (not a pretty chart). I specified a date range, as I did for Bitcoin in the News : 2018-09 Price (October 2018), and where I remarked,
The data granularity for a specified date range appears to be a full day; the granularity of the monthly chart appears to be six hours. That accounts for the difference in the look of the chart.

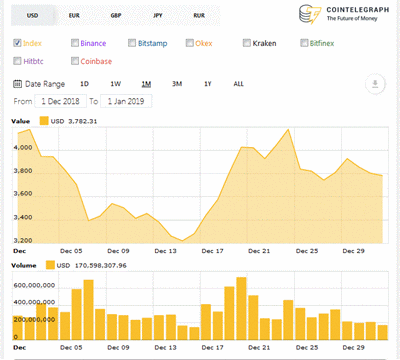
Anyway, here's the chart for December 2018.


Bitcoin (BTC) Price Index (cointelegraph.com)

The chart shows a painful drop from $4200 to $3200 during the first half of the month, bottoming at mid-month. That was followed by a sharp one week rise leading to a gentle decline that lasted into the new year.

Cointelegraph's Analysis category made no attempt to explain any of those three trends, focusing instead on stories like From Blanket Ban to Its Own Stablecoin: How Facebook’s Relationship With Crypto Changed Over 2018, which was the last article in the category for the year 2018. Cointelegraph's Price Analysis tag had three stories that coincided with the three stages in the month's chart:-

The analysis continued with a cautious prognostication:-

A year later, after a massive bear market, the question in every investor’s mind is, can Bitcoin rise from the dead once again and stage a turnaround? While we believe that Bitcoin is closer to a bottom than ever, we do not expect a sharp rally from current levels. There is a huge overhang of positions that will liquidate when the virtual currency attempts a recovery. Hence, it will be a slow and laborious move higher.

This forecast was based on a plausible scenario:-

Fundamental factors like actual utility, clear regulations and wider adoption of the technology will attract institutional investors who will drive the next leg up. All of this will require time and will not happen overnight.

The second stage was that one week runup:-

  • 2018-12-24: Bitcoin, Ripple, [etc...]: Price Analysis, Dec. 24 • 'Christmas has brought some cheer to the crypto traders. The total crypto market capitalization has spiked by about 29 percent from just under $101 billion on Dec. 15 to $143 billion on Christmas Eve. Though it is still way below its all-time-high, the growth over the past few days is showing signs of a bottom formation.'

The situation mid-month could indeed have been a bottom. Looking back at the previous monthly charts for 2018, there was no other month that looked like December. The analysis covering the third stage was:-

Have excesses been removed? The year 2018 ended with a bitcoin price four times greater than at yearend 2016.

I have one more small analysis to make before I close this post. In the '2018-11 Price' post, I noted,

Back to the November chart, I noticed that there are three additional price sources available over what was shown in the '2018-10 Price' post.

Here's a similar analyis for the December chart, which also shows changes.

(A : 2018-11 Price) Index, Bitstamp, Bitfinex, Hitbtc, Huobi, Poloniex, Kraken, Binance, Okex, Coin

(B : 2018-12 Price) Index (A1), Okex (A9), Binance (A8), Bitstamp (A2), Kraken (A7), Bitfinex (A3), Hitbtc (A4), Coinbase (A10?)

Ten price sources end-November dropped to eight sources end-December. Huobi and Poloniex disappeared, after appearing for the first time end-November. One of the differences, Coin/Coinbase, was due to an error on my part, not noticing a slider. If that was the only error I made in the previous post, I'll consider myself lucky.